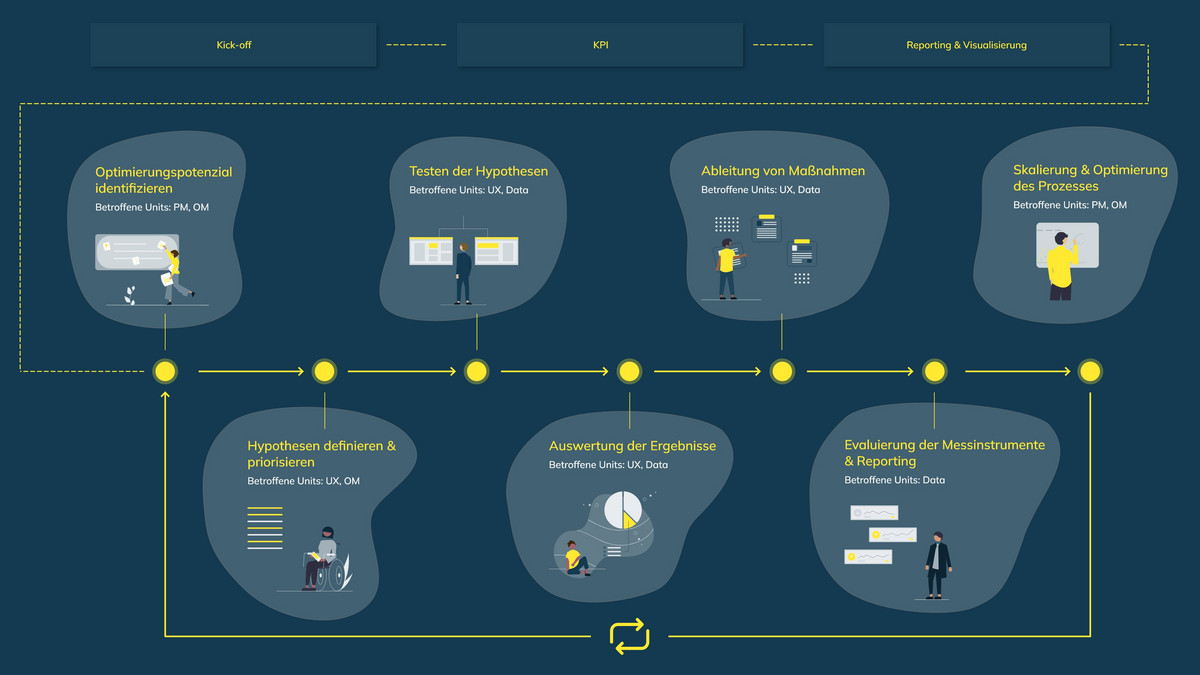
How does performance analytics work?
Initial setup - define, implement & visualize
The success of performance analytics is based on a comprehensive setup: Together with you, we determine which questions we want to answer and which goals we want to achieve. In doing so, we take into account all the important contact points that your customers have with your website or online campaign. We collect and analyze the necessary digital data and present the results clearly and comprehensibly. This way, you know exactly what happens throughout the entire user journey. Our data experts create the perfect basis for optimizing your online sales.
Identify goals and KPIs
We then look at the current status and activities of the sales channels together at the kick-off meeting: Which tools are already being used and which data sources are being accessed?
We work together to identify the key performance indicators that can be used to measure and evaluate the progress and success of all activities. Important KPIs in online marketing can be, for example:
- Conversion rates and e-commerce conversion rates: How many users become customers or buyers?
- Lead conversion rate & cost-per-lead: How effective and cost-intensive are lead campaigns?
- Website interaction: dwell time and bounce rate of users
- Customer retention (new/returning users)
- ROAS (Return on Advertising Spend) measures the effectiveness of digital advertising campaigns.
Definition and implementation
We create a compelling user experience by understanding the needs of your target audience and providing relevant content. We test our purchase decision assumptions with data analytics to see what works. We use tools such as Google Analytics, Piwik Pro and Hotjar. All technical implementations comply with data protection regulations. This gives you effective decision-making tools and a deeper understanding of your customers, which increases your success.
Identify optimization potential
Can the visibility of the site be further optimized with SEO? Can the technical performance of the website (loading speed, 404 errors) be improved? And what do click, conversion or lead funnels show? These questions, among others, are relevant in order to be able to draw up hypotheses.
Define & prioritize hypotheses
An example: A subpage generates a lot of organic traffic, but at the same time has a high bounce rate. How can this be? Does something perhaps change if you add a teaser to a referring page in the top third of the page? That would be just one of many hypotheses we could put forward. Prioritizing the hypotheses is essential for greater effectiveness.
Testing the hypotheses
The defined hypotheses are implemented and tested for a certain period of time. This takes the form of A/B testing, for example, in which two or more variants of a website, email or ad are tested and compared in terms of their effect on users.
Evaluation of the results
For this, we rely on proven BI tools such as Google Looker Studio. Clearly presented information on data evaluations from various channels is also available on an ongoing basis. This includes:
- Website data from web analytics tools such as Google Analytics,
- data from digital advertising channels such as Google or Facebook Ads,
- data from CRM and ERP systems and
- definitions and visualizations of lead or conversion funnels
Derivation of measures
You receive specific recommendations for action that you can use to improve the user experience and sales. We always look at the objective as such, the measurement tools used and the type of visualization in the reporting.
Evaluation of the measuring instruments & reporting
All measures are continuously monitored and their effectiveness can be tracked at any time in the Google Looker Studio dashboard. Your benefit from the evaluation in Google Looker Studio is that we bring together all data sources and the departments involved and evaluate them holistically. We act as a link for your various company departments, such as sales, marketing and data management, and show how they contribute to successful analysis.
Scaling & optimization of the process
We carry out regular consultations with all project participants and, if necessary, other service providers. We also take all other influences on the website and online marketing performance into account during the evaluation. This could be new campaigns, landing pages, UX elements or technical adjustments, for example. This allows us to continuously optimize your digital strategy and adjust KPIs, goals and target groups for the next cycle based on the data analysis.


